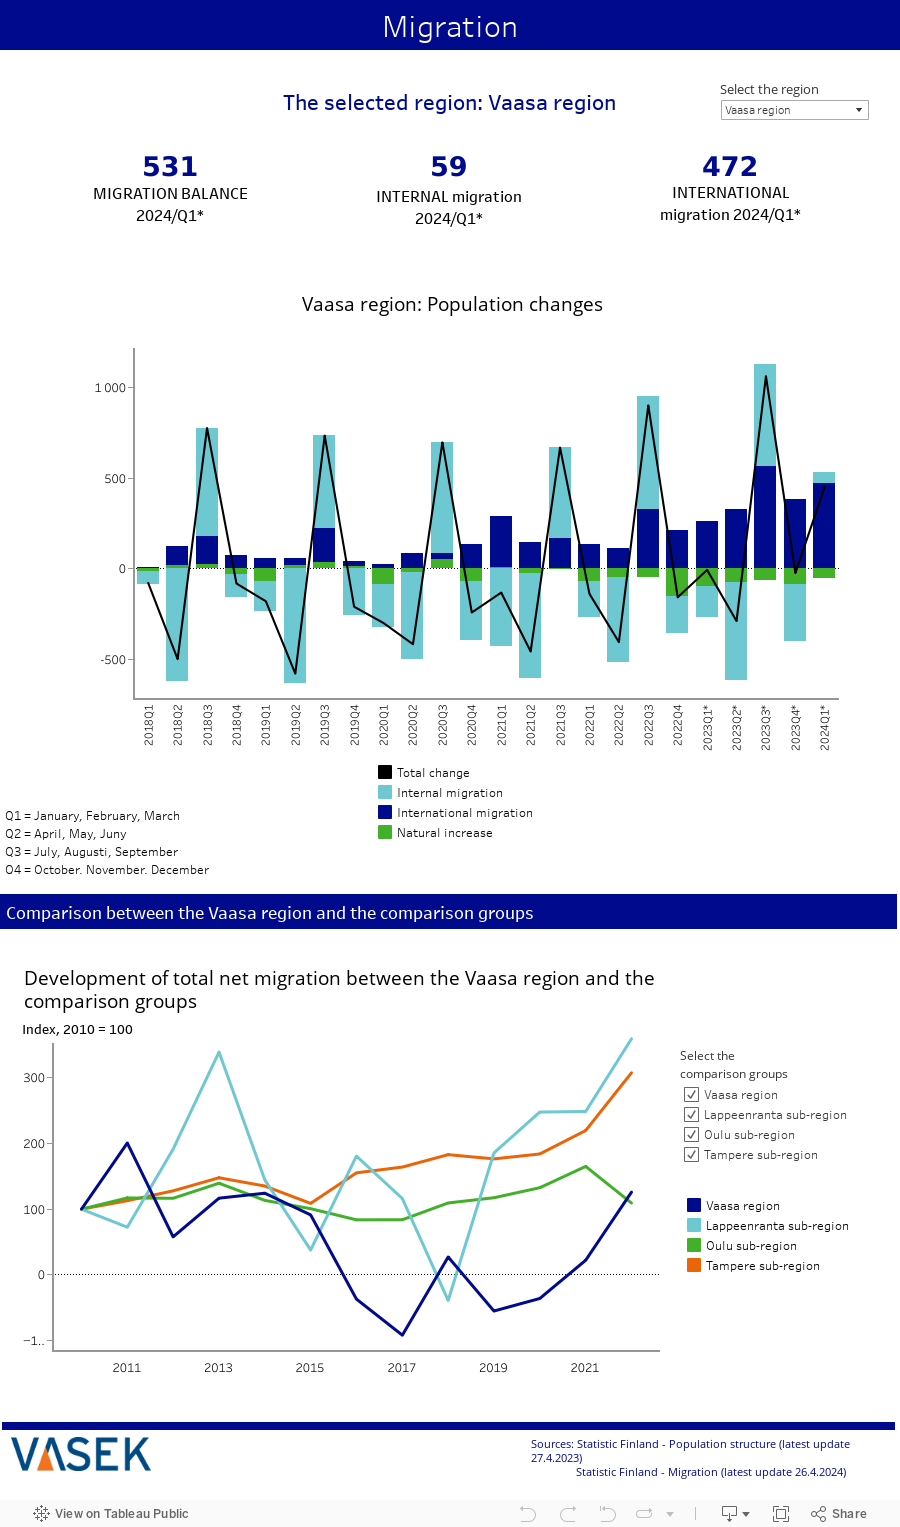
Migration balance. The indicator shows the total net migration, i.e., the sum of the internal migration (net migration between municipalities) and international migration (net immigration).
Internal migration. The indicator shows net migration between municipalities, i.e., the difference between the number of immigrants (people coming into a municipality) and the number of emigrants (people leaving a municipality).
International migration. The indicator shows net immigration, i.e., the difference between immigration and emigration.
Natural increase. Excess of births, i.e., the difference between live births and deaths.
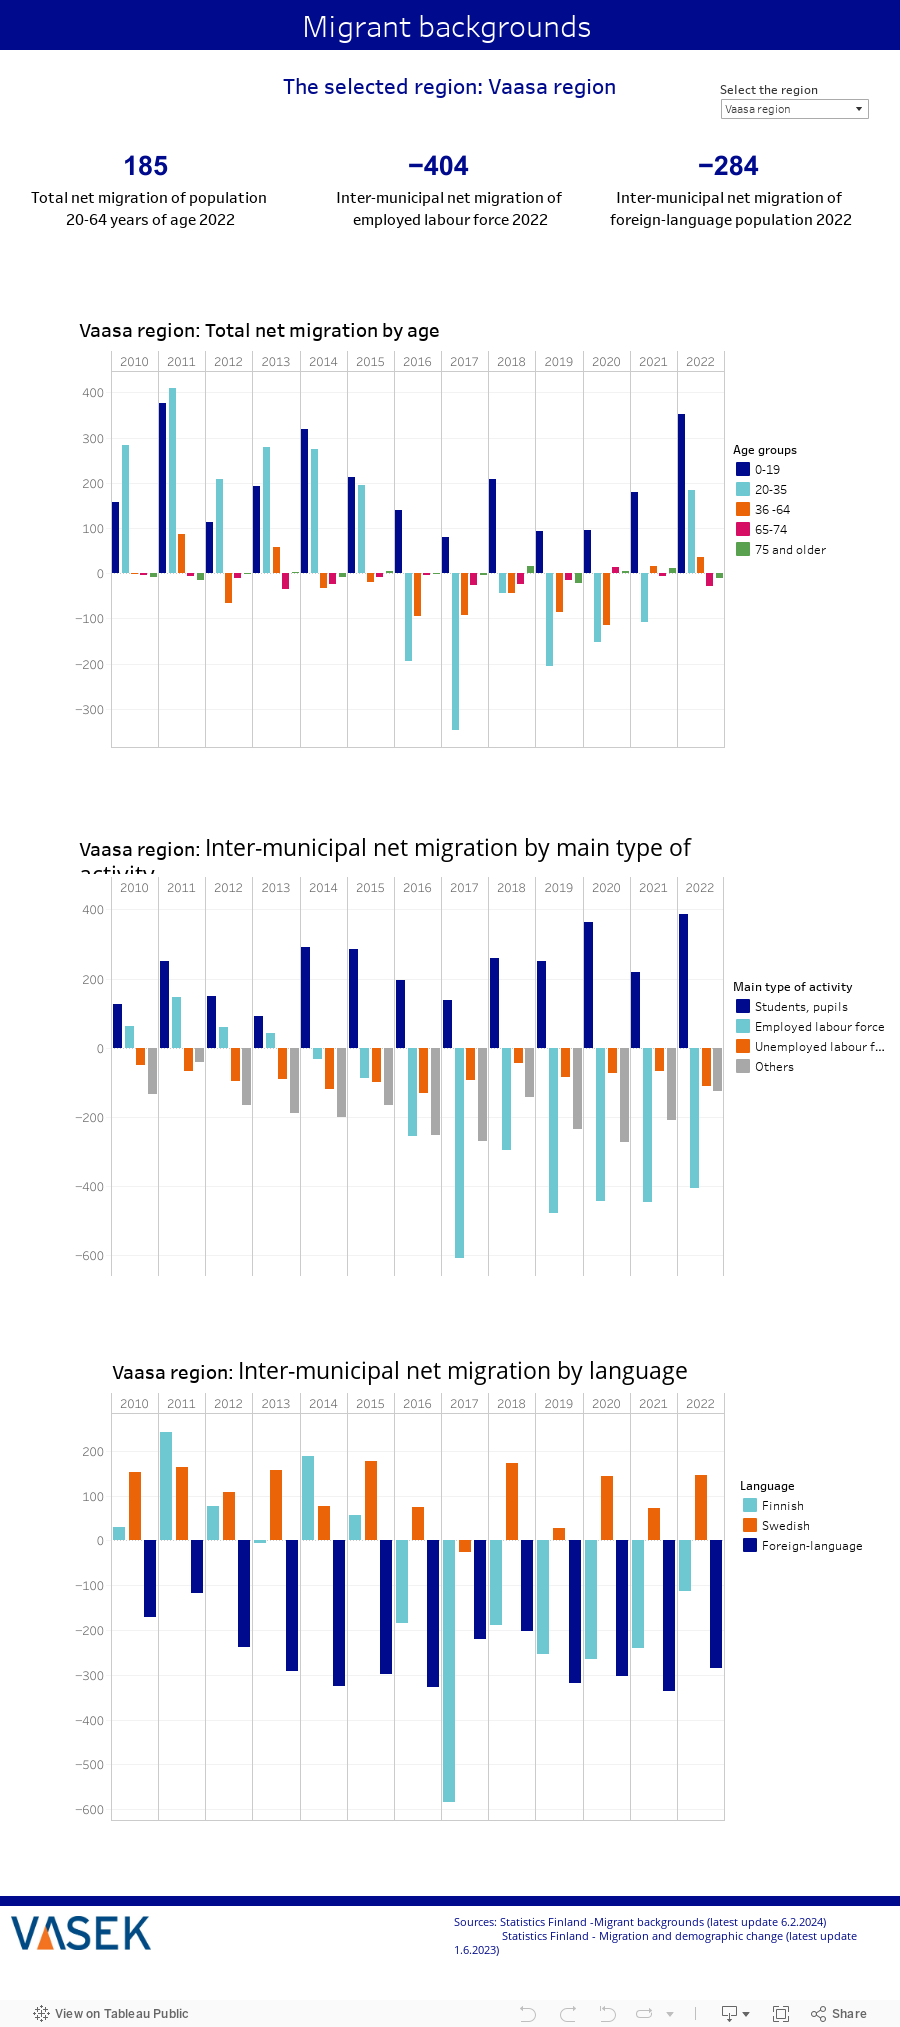
Migration by age is based on total net migration which includes inter-municipal net migration and net migration. Migration by economic activity and migration by language includes only inter-municipal net migration.
Age in total net migration is based on the age on the actual day of the migration.
Language is based on the native language of the migrant.
Main type of activity describes the nature of a person’s economic activity.
A student or a pupil is a person over 15 years of age who is studying full-time in an educational institution and is neither gainfully employed nor unemployed. Data on student numbers is collected according to the existing situation in September. However, during the last week of the year their main activity may also be registered as employed, unemployed or conscript.
The employed labour force includes all persons aged 18 to 74 who were in gainful employment in the last week of the year and were not registered as unemployed job seekers in the job seeker register of the Ministry of Economic Affairs and Employment or performing mandatory military or non-military service. Data on employment are based on the information from the employment pension authorities and the tax administration.
The unemployed labour force includes all persons aged 16 to 64 who were unemployed on the last weekday of the year. Data on unemployment is derived from the job seeker register of the Ministry of Economic Affairs and Employment.
The ‘others’ group in the main type of activity includes persons who are under 15 years of age, conscripts and conscientious objectors, pensioners and other economically inactive persons.
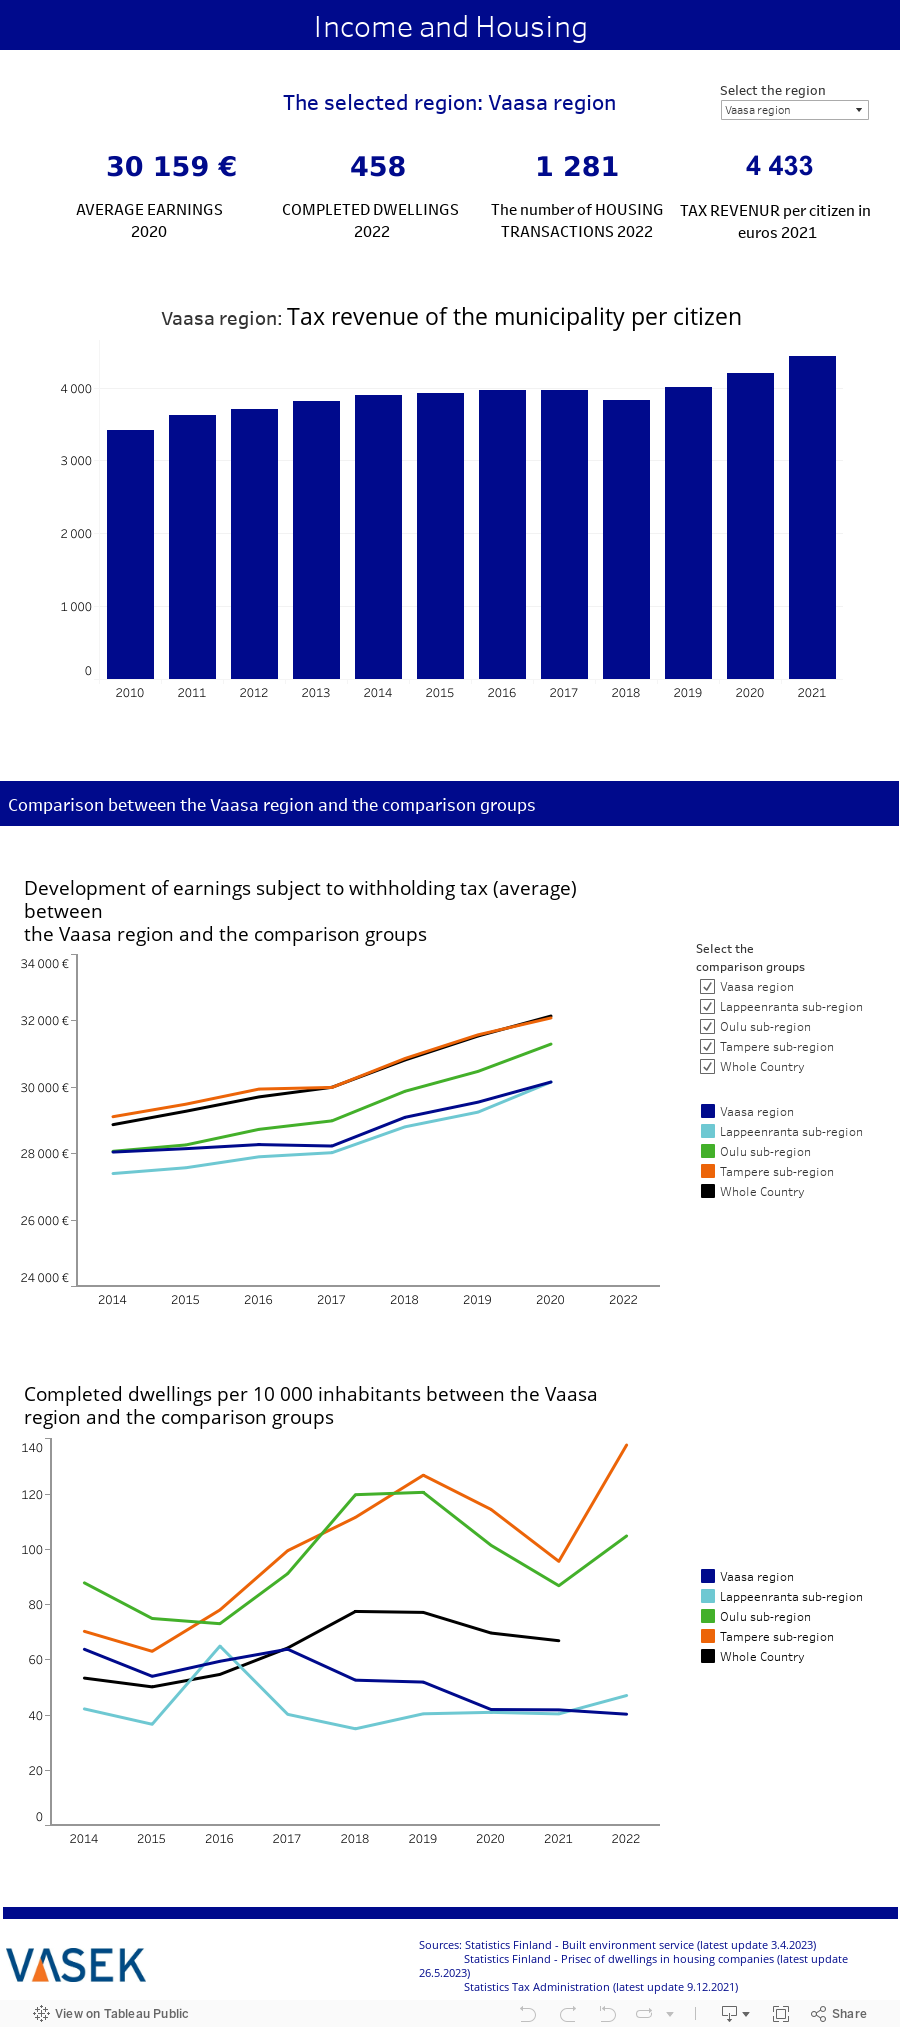
Average earnings. The indicator shows average earnings subject to withholding tax in the area, based on data from the Tax Administration.
Completed dwellings. Residential buildings completed during the year where at least half of the floor area is residential area. New housing production is an indication of the attractiveness of the area. The proportional indicator in the graph describes all new dwellings completed in the area and in annual proportion to the average population in the area. The review per 10,000 inhabitants allows for a better comparison of different areas.
The number of housing transactions. The indicator shows information received from the Tax Administration on changes in apartment ownership and transfer tax returns, by the time of publication.
The number of transactions includes Hitas and Arava dwellings, as well as, for example, observations that differ in area and price per square metre which are removed from the index calculation and the calculation of price per square metre.
Per capita tax revenue includes tax revenue of the municipalities, i.e., municipal tax, share of corporation tax and other tax revenue (including real estate tax).
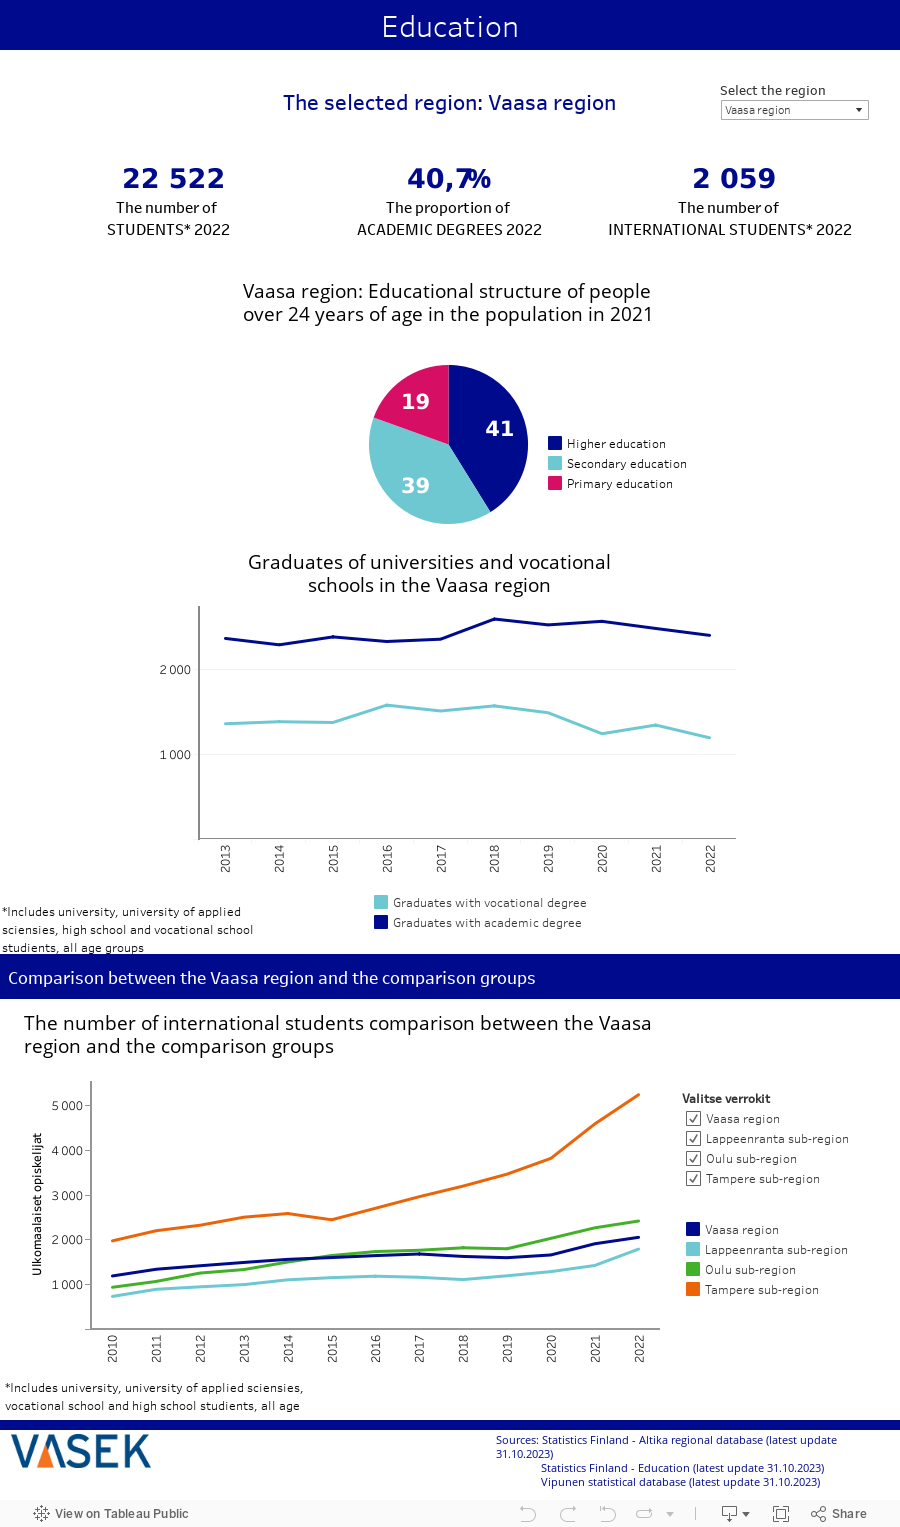
The number of students. The indicator shows the total number of university, polytechnic, high school and vocational school students in the area. The data has been compiled according to the place of study.
The proportion of academic degrees. The indicator shows the share of academic degrees in the population aged 15 and over. The number includes those who have completed Bachelor, Master or Doctoral level.
The number of international students. The number of international students includes university, polytechnic, high school and vocational students, all age groups.
Graduates with a vocational degree / academic degree. The indicator shows how many graduated from an educational institution located in the region / municipality in the examined year.